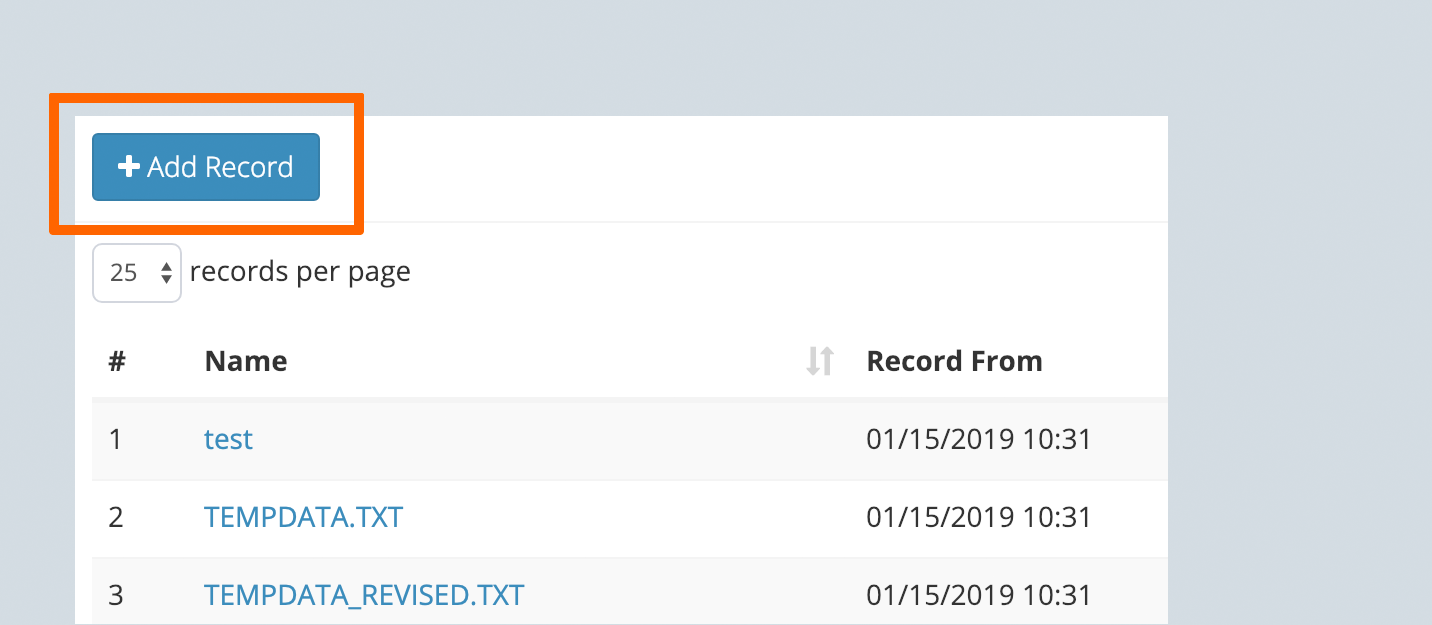
Step 1
1. Click 'Add Record' button.
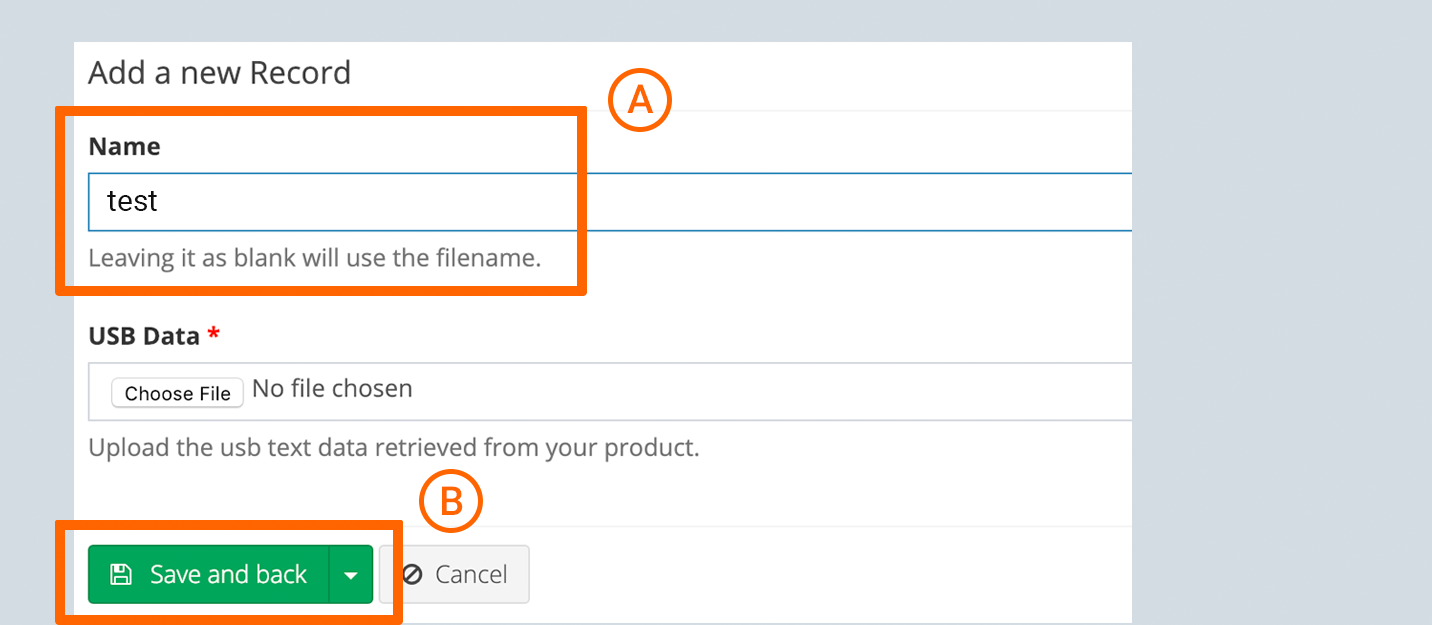
Step 2
1. Give a name to the data you are uploading. Leave empty if you want to use the file name as the record name. A*
2. Upload USB Data downloaded from your product.
3. Click 'Save and back' button to add your data. B*
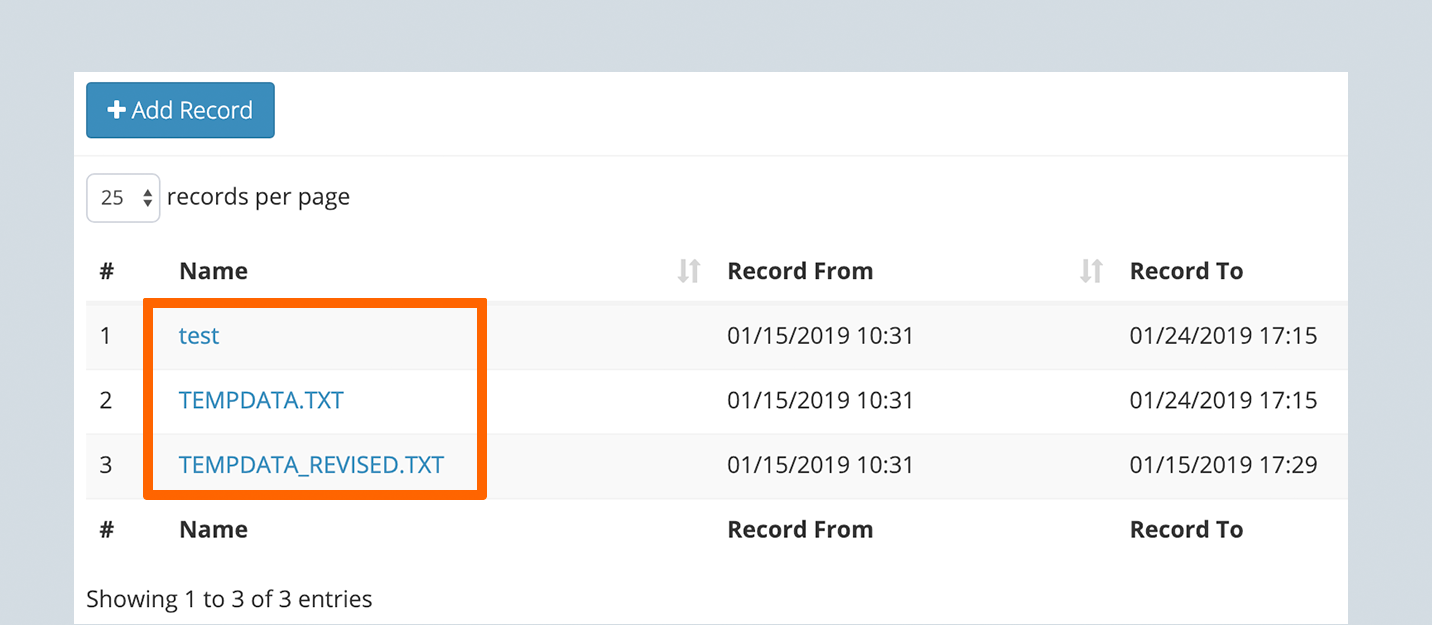
Step 3
1. Click the Record name to view.
2. Note that records are only kept for two hours. All the records older than two hours will be automatically deleted. *
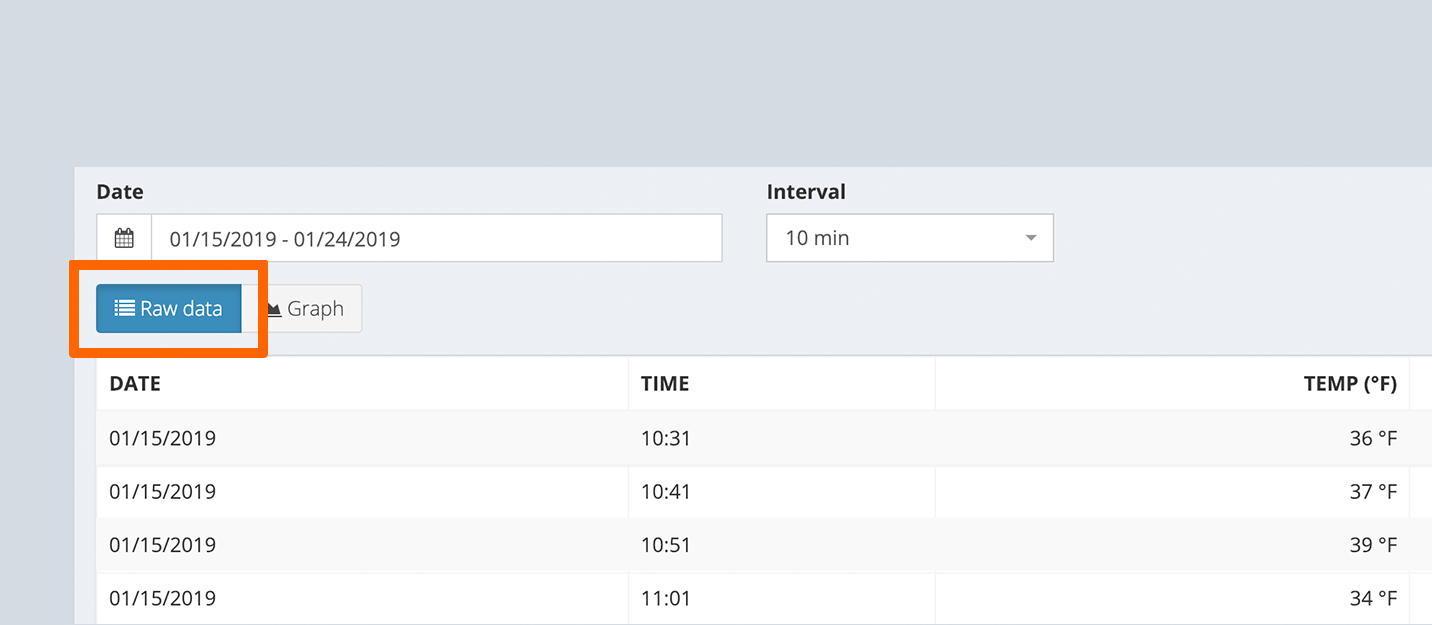
USB Data Page: Table View
1. Click 'Raw data' to view your data in table format.
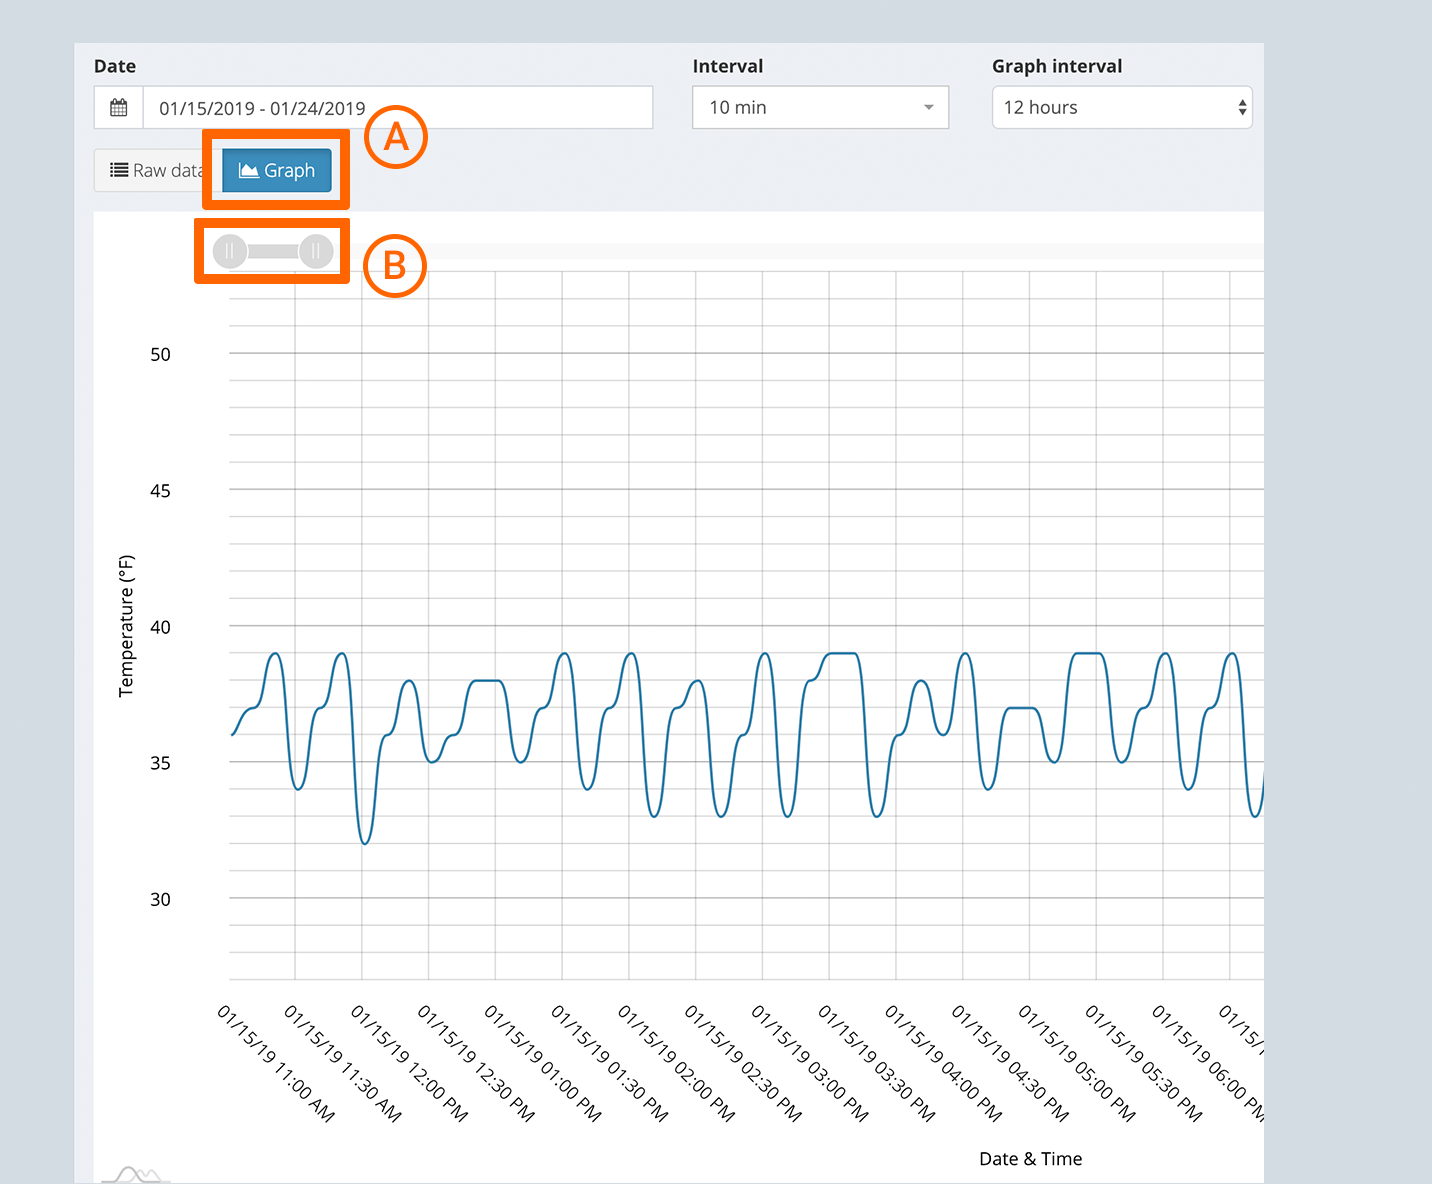
USB Data Page: Graph View
1. Click 'Graph' to view your data in graph format. A*
2. Control graph length, position, and zoom with the graph handle. B*
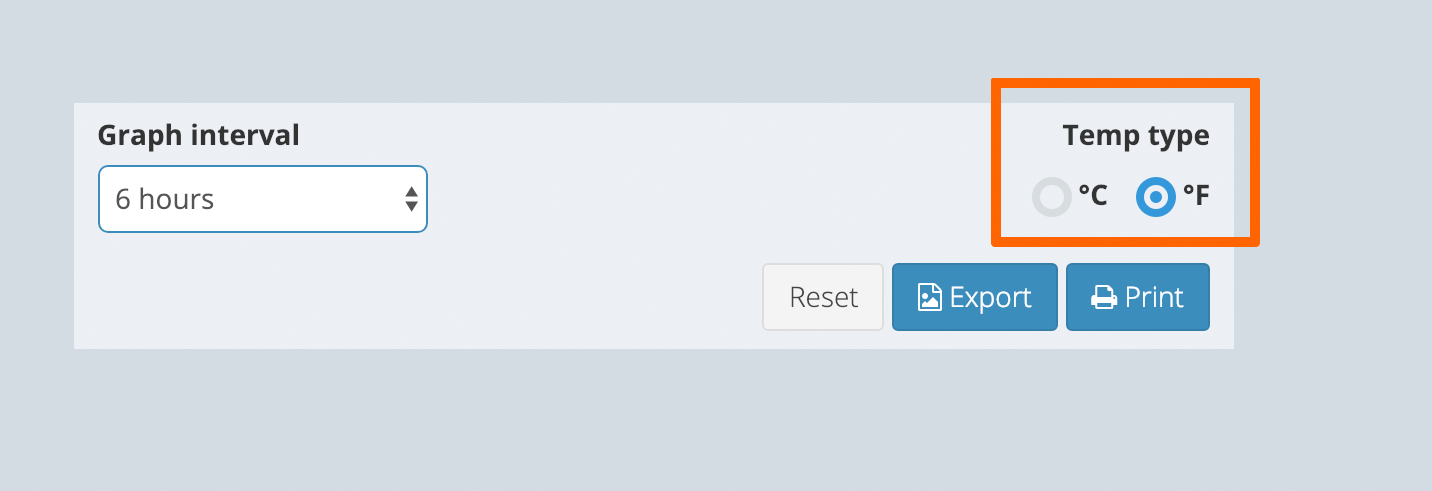
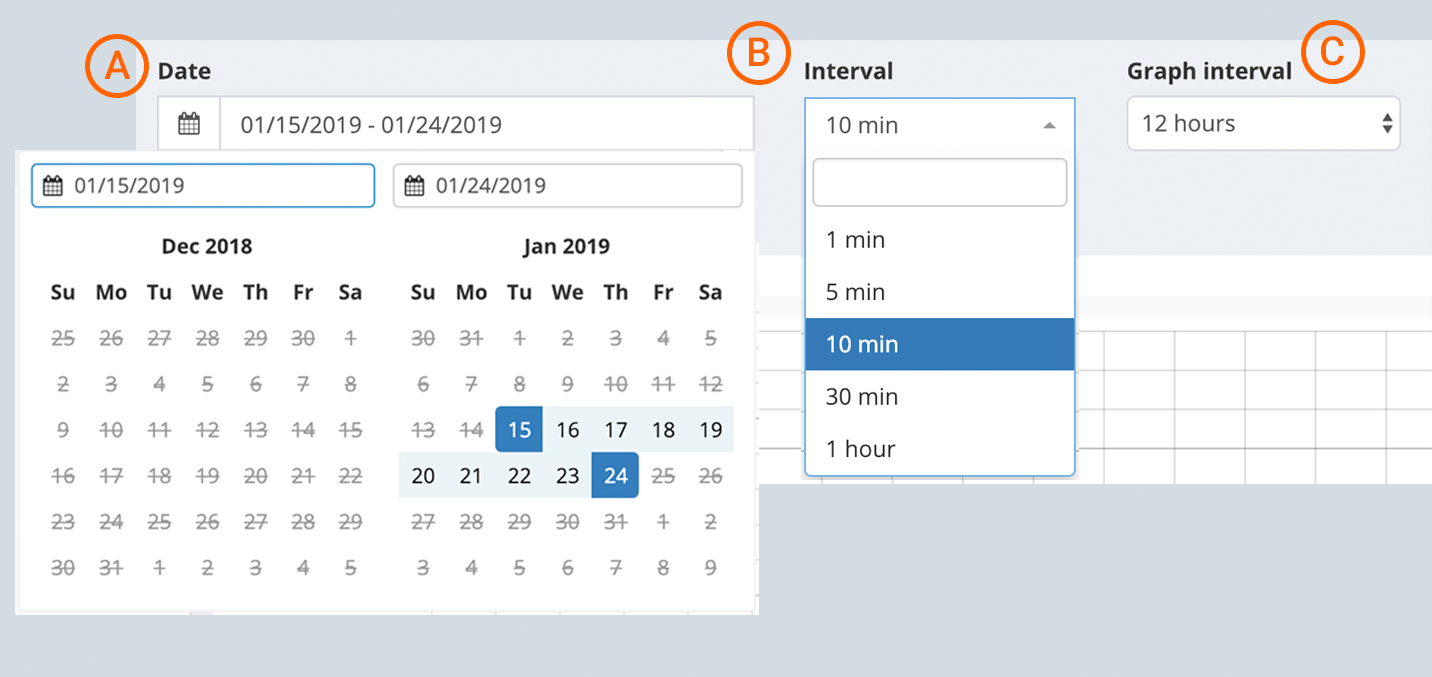
USB Data Page: Controls
1. You can adjust and manipulate data result by using controls.
2. You can Change date range within the range of the data set. A*
3. You can Change data interval. B*
3. In Graph View, you can adjust the graph interval C*
USB Data Page: Controls
1. You can also toggle the temperature type between F and C